|
chr6_-_169392771
|
2.774
|
|
|
|
|
chr17_-_78391178
|
2.481
|
NM_024702
|
ZNF750
|
zinc finger protein 750
|
|
chr22_+_19239221
|
2.052
|
|
MED15
|
mediator complex subunit 15
|
|
chr20_-_60435983
|
1.804
|
NM_080833
|
C20orf151
|
chromosome 20 open reading frame 151
|
|
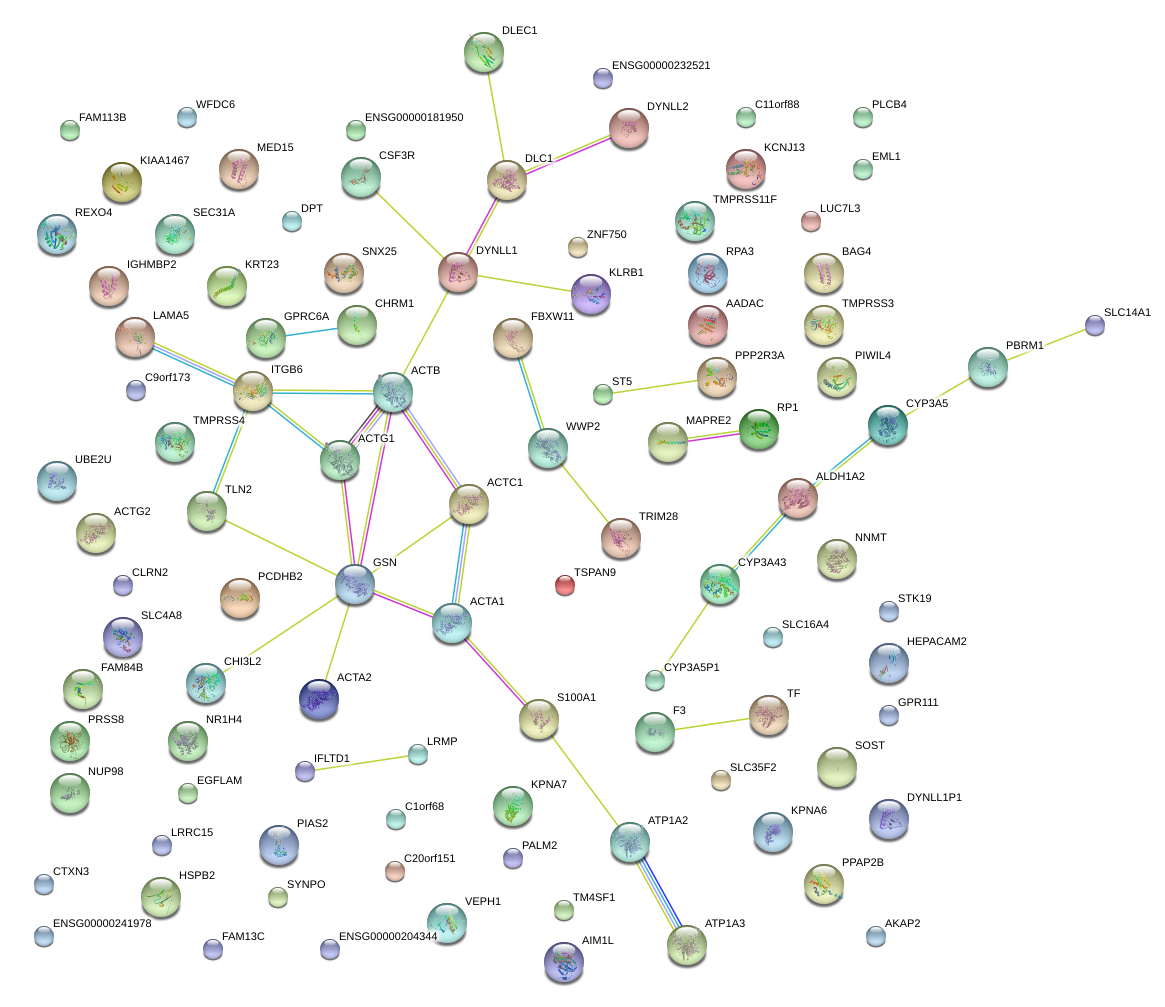
chr18_+_41558141
|
1.637
|
|
SLC14A1
|
solute carrier family 14 (urea transporter), member 1 (Kidd blood group)
|
|
chr8_+_55691179
|
1.547
|
NM_006269
|
RP1
|
retinitis pigmentosa 1 (autosomal dominant)
|
|
chr2_+_73973600
|
1.491
|
NM_001615
|
ACTG2
|
actin, gamma 2, smooth muscle, enteric
|
|
chr6_+_47732181
|
1.454
|
NM_153839
|
GPR111
|
G protein-coupled receptor 111
|
|
chr7_-_98643024
|
1.439
|
NM_001145715
|
KPNA7
|
karyopherin alpha 7 (importin alpha 8)
|
|
chr7_-_99115454
|
1.433
|
NM_000777
NM_001190484
|
CYP3A5
|
cytochrome P450, family 3, subfamily A, polypeptide 5
|
|
chr2_+_73973640
|
1.419
|
|
ACTG2
|
actin, gamma 2, smooth muscle, enteric
|
|
chr11_+_111288686
|
1.231
|
|
HSPB2-C11ORF52
HSPB2
|
HSPB2-C11orf52 read-through transcript
heat shock 27kDa protein 2
|
|
chr3_+_137224266
|
1.226
|
NM_181897
|
PPP2R3A
|
protein phosphatase 2, regulatory subunit B'', alpha
|
|
chr15_-_56093477
|
1.150
|
NM_170697
|
ALDH1A2
|
aldehyde dehydrogenase 1 family, member A2
|
|
chr1_-_26553168
|
1.110
|
NM_001039775
|
AIM1L
|
absent in melanoma 1-like
|
|
chr2_-_233349469
|
1.104
|
NM_001172416
NM_001172417
NM_002242
|
KCNJ13
|
potassium inwardly-rectifying channel, subfamily J, member 13
|
|
chr1_+_150958621
|
1.101
|
NM_001024679
|
C1orf68
|
chromosome 1 open reading frame 68
|
|
chr11_+_111288669
|
1.058
|
NM_001541
|
HSPB2-C11ORF52
HSPB2
|
HSPB2-C11orf52 read-through transcript
heat shock 27kDa protein 2
|
|
chr17_-_39191658
|
1.040
|
NM_025237
|
SOST
|
sclerostin
|
|
chr1_-_110735158
|
1.022
|
NM_004696
|
SLC16A4
|
solute carrier family 16, member 4 (monocarboxylic acid transporter 5)
|
|
chr11_+_110890719
|
0.988
|
NM_001100388
NM_207430
|
C11orf88
|
chromosome 11 open reading frame 88
|
|
chr9_+_123088217
|
0.957
|
|
GSN
|
gelsolin
|
|
chr11_-_8789457
|
0.939
|
NM_139157
|
ST5
|
suppression of tumorigenicity 5
|
|
chr9_+_139265533
|
0.923
|
NM_001004353
|
C9orf173
|
chromosome 9 open reading frame 173
|
|
chr7_-_92686773
|
0.913
|
NM_198151
|
HEPACAM2
|
HEPACAM family member 2
|
|
chr20_-_43601542
|
0.905
|
NM_080827
|
WFDC6
|
WAP four-disulfide core domain 6
|
|
chr3_-_52688768
|
0.898
|
NM_018165
NM_181042
|
PBRM1
|
polybromo 1
|
|
chr16_+_68516401
|
0.886
|
NM_199424
|
WWP2
|
WW domain containing E3 ubiquitin protein ligase 2
|
|
chr15_+_60838053
|
0.886
|
|
TLN2
|
talin 2
|
|
chr1_+_158352143
|
0.849
|
NM_000702
|
ATP1A2
|
ATPase, Na+/K+ transporting, alpha 2 polypeptide
|
|
chr17_-_45620313
|
0.822
|
|
|
|
|
chr17_-_36347197
|
0.818
|
NM_015515
|
KRT23
|
keratin 23 (histone deacetylase inducible)
|
|
chr4_+_186368277
|
0.787
|
NM_031953
|
SNX25
|
sorting nexin 25
|
|
chr11_-_62445308
|
0.773
|
|
CHRM1
|
cholinergic receptor, muscarinic 1
|
|
chr12_-_25597444
|
0.765
|
NM_152590
NM_001145728
NM_001145729
|
IFLTD1
|
intermediate filament tail domain containing 1
|
|
chr12_+_45896511
|
0.757
|
|
FAM113B
|
family with sequence similarity 113, member B
|
|
chr4_-_68678181
|
0.750
|
NM_207407
|
TMPRSS11F
|
transmembrane protease, serine 11F
|
|
chr8_-_11742668
|
0.719
|
|
|
|
|
chr12_+_25096755
|
0.713
|
|
LRMP
|
lymphoid-restricted membrane protein
|
|
chr2_-_160765008
|
0.712
|
|
ITGB6
|
integrin, beta 6
|
|
chr10_-_60792225
|
0.710
|
NM_001001971
NM_001166698
NM_198215
|
FAM13C
|
family with sequence similarity 13, member C
|
|
chr17_+_46176105
|
0.702
|
|
LUC7L3
|
LUC7-like 3 (S. cerevisiae)
|
|
chr5_+_38481392
|
0.700
|
NM_182801
|
EGFLAM
|
EGF-like, fibronectin type III and laminin G domains
|
|
chr1_-_166965034
|
0.696
|
NM_001937
|
DPT
|
dermatopontin
|
|
chr14_+_99309688
|
0.679
|
|
EML1
|
echinoderm microtubule associated protein like 1
|
|
chr11_-_3759886
|
0.679
|
|
NUP98
|
nucleoporin 98kDa
|
|
chr1_-_56750235
|
0.675
|
|
PPAP2B
|
phosphatidic acid phosphatase type 2B
|
|
chr5_+_150000394
|
0.652
|
NM_001109974
NM_007286
|
SYNPO
|
synaptopodin
|
|
chr9_+_111442888
|
0.649
|
NM_001037293
|
PALM2
|
paralemmin 2
|
|
chr11_+_93940121
|
0.639
|
NM_152431
|
PIWIL4
|
piwi-like 4 (Drosophila)
|
|
chr1_+_64442077
|
0.637
|
NM_152489
|
UBE2U
|
ubiquitin-conjugating enzyme E2U (putative)
|
|
chr16_-_31054321
|
0.636
|
|
PRSS8
|
protease, serine, 8
|
|
chr3_+_134978615
|
0.631
|
|
TF
|
transferrin
|
|
chr3_-_195571748
|
0.627
|
NM_001135057
NM_130830
|
LRRC15
|
leucine rich repeat containing 15
|
|
chr3_+_153014550
|
0.626
|
NM_001086
|
AADAC
|
arylacetamide deacetylase (esterase)
|
|
chr20_+_9146036
|
0.611
|
NM_182797
|
PLCB4
|
phospholipase C, beta 4
|
|
chr21_-_42689192
|
0.611
|
NM_024022
NM_032405
|
TMPRSS3
|
transmembrane protease, serine 3
|
|
chr20_-_60360789
|
0.610
|
|
LAMA5
|
laminin, alpha 5
|
|
chr4_+_17125885
|
0.607
|
NM_001079827
|
CLRN2
|
clarin 2
|
|
chr7_-_7724762
|
0.599
|
NM_002947
|
RPA3
|
replication protein A3, 14kDa
|
|
chr7_+_99263571
|
0.588
|
NM_022820
NM_057095
NM_057096
|
CYP3A43
|
cytochrome P450, family 3, subfamily A, polypeptide 43
|
|
chr11_+_113672407
|
0.588
|
|
NNMT
|
nicotinamide N-methyltransferase
|
|
chr16_+_54158084
|
0.584
|
NM_032330
|
CAPNS2
|
calpain, small subunit 2
|
|
chr3_-_158700036
|
0.580
|
NM_024621
|
VEPH1
|
ventricular zone expressed PH domain homolog 1 (zebrafish)
|
|
chr12_+_99391681
|
0.577
|
NM_005123
|
NR1H4
|
nuclear receptor subfamily 1, group H, member 4
|
|
chr8_-_13018123
|
0.573
|
NM_001164271
|
DLC1
|
deleted in liver cancer 1
|
|
chr1_+_111573855
|
0.570
|
NM_001025199
|
CHI3L2
|
chitinase 3-like 2
|
|
chr5_+_127012611
|
0.559
|
NM_001048252
|
CTXN3
|
cortexin 3
|
|
chr3_-_150578103
|
0.558
|
|
TM4SF1
|
transmembrane 4 L six family member 1
|
|
chr6_-_117256890
|
0.557
|
NM_148963
|
GPRC6A
|
G protein-coupled receptor, family C, group 6, member A
|
|
chr1_+_151867483
|
0.550
|
NM_006271
|
S100A1
|
S100 calcium binding protein A1
|
|
chr5_+_140454382
|
0.544
|
NM_018936
|
PCDHB2
|
protocadherin beta 2
|
|
chr1_-_36721010
|
0.540
|
|
CSF3R
|
colony stimulating factor 3 receptor (granulocyte)
|
|
chr2_+_121271336
|
0.537
|
NM_005270
|
GLI2
|
GLI family zinc finger 2
|
|
chr17_+_74542066
|
0.537
|
NM_198593
|
C1QTNF1
|
C1q and tumor necrosis factor related protein 1
|
|
chr11_-_5212168
|
0.530
|
NM_000519
|
HBD
|
hemoglobin, delta
|
|
chr3_-_117647053
|
0.529
|
NM_002338
|
LSAMP
|
limbic system-associated membrane protein
|
|
chr11_-_59390518
|
0.523
|
NM_001062
|
TCN1
|
transcobalamin I (vitamin B12 binding protein, R binder family)
|
|
chr11_+_111294868
|
0.521
|
|
C11orf52
|
chromosome 11 open reading frame 52
|
|
chr5_+_140690387
|
0.521
|
NM_018912
NM_031993
|
PCDHGA1
|
protocadherin gamma subfamily A, 1
|
|
chr8_-_86477585
|
0.520
|
NM_001128829
NM_001128830
NM_001128831
NM_001738
|
CA1
|
carbonic anhydrase I
|
|
chr22_+_16423147
|
0.519
|
NM_031481
|
SLC25A18
|
solute carrier family 25 (mitochondrial carrier), member 18
|
|
chr12_-_54522881
|
0.519
|
NM_002429
|
MMP19
|
matrix metallopeptidase 19
|
|
chr1_+_40508336
|
0.514
|
|
ZMPSTE24
|
zinc metallopeptidase (STE24 homolog, S. cerevisiae)
|
|
chr11_+_114054409
|
0.502
|
NM_182495
|
FAM55B
|
family with sequence similarity 55, member B
|
|
chr11_+_113672378
|
0.500
|
|
NNMT
|
nicotinamide N-methyltransferase
|
|
chr2_+_69055208
|
0.494
|
NM_019617
|
GKN1
|
gastrokine 1
|
|
chr19_-_9087438
|
0.491
|
NM_001005192
|
OR7G1
|
olfactory receptor, family 7, subfamily G, member 1
|
|
chr3_-_150578148
|
0.483
|
|
TM4SF1
|
transmembrane 4 L six family member 1
|
|
chr7_+_143263191
|
0.481
|
NM_001004685
|
OR2F2
|
olfactory receptor, family 2, subfamily F, member 2
|
|
chr20_-_5982617
|
0.481
|
NM_152611
|
LRRN4
|
leucine rich repeat neuronal 4
|
|
chr5_+_140848905
|
0.480
|
NM_018929
NM_032407
|
PCDHGC5
|
protocadherin gamma subfamily C, 5
|
|
chr3_+_120375053
|
0.476
|
NM_006952
|
UPK1B
|
uroplakin 1B
|
|
chr3_+_115099007
|
0.473
|
NM_001172105
|
GRAMD1C
|
GRAM domain containing 1C
|
|
chr7_-_56128098
|
0.472
|
NM_006213
|
PHKG1
|
phosphorylase kinase, gamma 1 (muscle)
|
|
chr17_+_19917420
|
0.468
|
|
SPECC1
|
sperm antigen with calponin homology and coiled-coil domains 1
|
|
chr8_-_125785611
|
0.465
|
|
MTSS1
|
metastasis suppressor 1
|
|
chr3_-_150578023
|
0.463
|
|
TM4SF1
|
transmembrane 4 L six family member 1
|
|
chr4_+_14985272
|
0.458
|
NM_001135171
|
C1QTNF7
|
C1q and tumor necrosis factor related protein 7
|
|
chr18_+_41558089
|
0.452
|
NM_001128588
NM_001146036
NM_015865
|
SLC14A1
|
solute carrier family 14 (urea transporter), member 1 (Kidd blood group)
|
|
chr9_+_115958051
|
0.449
|
NM_032888
|
COL27A1
|
collagen, type XXVII, alpha 1
|
|
chr11_-_57728228
|
0.448
|
NM_001004459
|
OR1S2
|
olfactory receptor, family 1, subfamily S, member 2
|
|
chr15_+_100163424
|
0.448
|
NM_001005326
|
OR4F6
|
olfactory receptor, family 4, subfamily F, member 6
|
|
chr4_-_3503881
|
0.446
|
|
LRPAP1
|
low density lipoprotein receptor-related protein associated protein 1
|
|
chr1_-_160648429
|
0.439
|
NM_053282
|
SH2D1B
|
SH2 domain containing 1B
|
|
chr9_-_35860316
|
0.437
|
NM_001004487
|
OR13J1
|
olfactory receptor, family 13, subfamily J, member 1
|
|
chr5_-_58918031
|
0.434
|
NM_006203
|
PDE4D
|
phosphodiesterase 4D, cAMP-specific
|
|
chr12_+_99391870
|
0.434
|
|
NR1H4
|
nuclear receptor subfamily 1, group H, member 4
|
|
chr2_+_178893216
|
0.432
|
NM_145739
|
OSBPL6
|
oxysterol binding protein-like 6
|
|
chr11_+_111294810
|
0.430
|
NM_080659
|
C11orf52
|
chromosome 11 open reading frame 52
|
|
chr2_+_33213111
|
0.424
|
NM_000627
NM_001166264
NM_001166265
NM_001166266
|
LTBP1
|
latent transforming growth factor beta binding protein 1
|
|
chr6_+_12824873
|
0.423
|
|
PHACTR1
|
phosphatase and actin regulator 1
|
|
chr11_+_59580630
|
0.418
|
NM_001031666
NM_001031809
NM_006138
|
MS4A3
|
membrane-spanning 4-domains, subfamily A, member 3 (hematopoietic cell-specific)
|
|
chr19_-_14771947
|
0.400
|
NM_198944
|
OR7C1
|
olfactory receptor, family 7, subfamily C, member 1
|
|
chr12_+_70618892
|
0.395
|
NM_173353
|
TPH2
|
tryptophan hydroxylase 2
|
|
chr1_-_53972464
|
0.393
|
NM_147193
|
GLIS1
|
GLIS family zinc finger 1
|
|
chr8_-_23619866
|
0.392
|
NM_001136271
|
NKX2-6
|
NK2 transcription factor related, locus 6 (Drosophila)
|
|
chr4_+_120276386
|
0.391
|
NM_016599
|
MYOZ2
|
myozenin 2
|
|
chr17_+_23875085
|
0.389
|
NM_003593
|
FOXN1
|
forkhead box N1
|
|
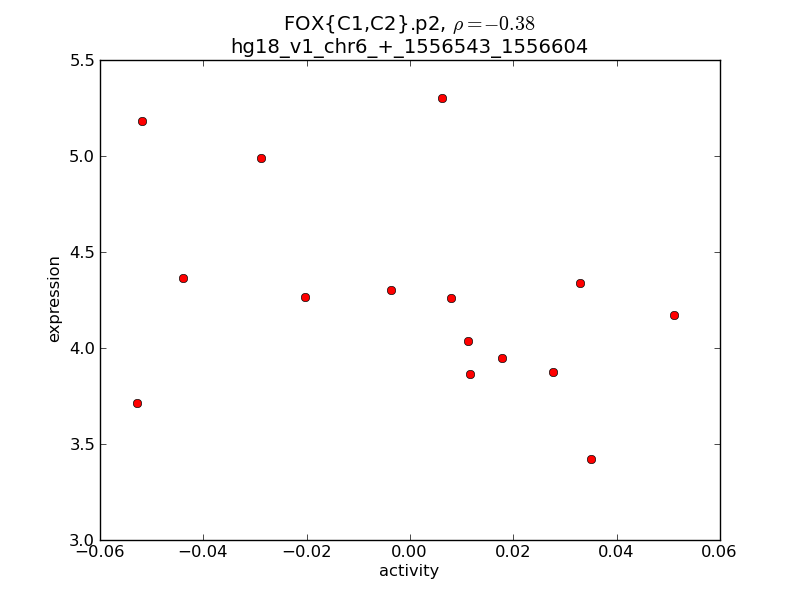
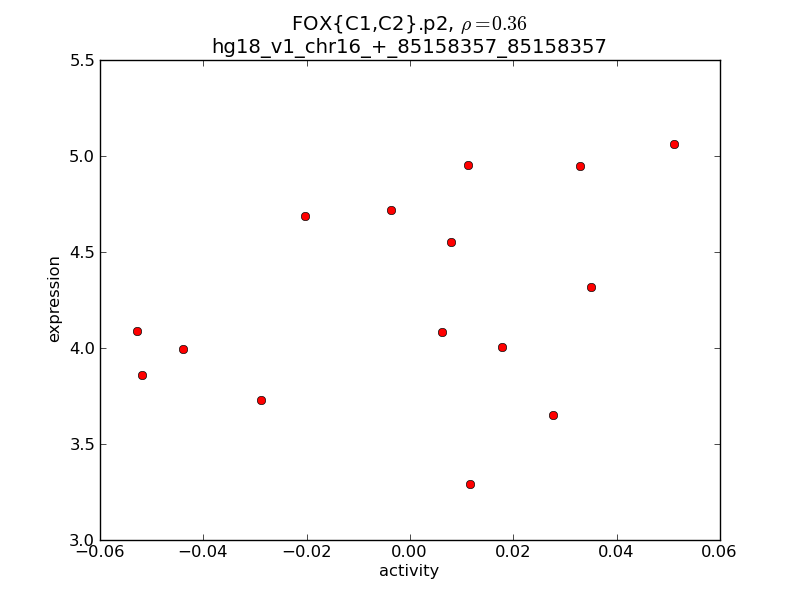
chr16_+_85158357
|
0.376
|
NM_005251
|
FOXC2
|
forkhead box C2 (MFH-1, mesenchyme forkhead 1)
|
|
chr6_+_42896771
|
0.374
|
NM_015349
|
KIAA0240
|
KIAA0240
|
|
chr8_-_110689396
|
0.371
|
|
SYBU
|
syntabulin (syntaxin-interacting)
|
|
chr19_+_7859380
|
0.368
|
NM_025061
|
LRRC8E
|
leucine rich repeat containing 8 family, member E
|
|
chr6_+_12825022
|
0.366
|
|
PHACTR1
|
phosphatase and actin regulator 1
|
|
chr6_-_41230003
|
0.363
|
NM_178174
|
TREML1
|
triggering receptor expressed on myeloid cells-like 1
|
|
chr1_+_179269766
|
0.356
|
|
MR1
|
major histocompatibility complex, class I-related
|
|
chr12_-_53064565
|
0.354
|
|
ZNF385A
|
zinc finger protein 385A
|
|
chr6_+_12825818
|
0.353
|
NM_030948
|
PHACTR1
|
phosphatase and actin regulator 1
|
|
chr4_-_84254912
|
0.352
|
|
PLAC8
|
placenta-specific 8
|
|
chr2_-_167058829
|
0.351
|
|
SCN7A
|
sodium channel, voltage-gated, type VII, alpha
|
|
chr17_-_3740785
|
0.349
|
NM_172206
|
CAMKK1
|
calcium/calmodulin-dependent protein kinase kinase 1, alpha
|
|
chr6_+_72982865
|
0.349
|
NM_001168409
|
RIMS1
|
regulating synaptic membrane exocytosis 1
|
|
chr11_-_85107569
|
0.347
|
NM_206929
|
SYTL2
|
synaptotagmin-like 2
|
|
chr6_+_31016755
|
0.347
|
NM_080870
|
DPCR1
|
diffuse panbronchiolitis critical region 1
|
|
chr7_-_87694218
|
0.342
|
NM_198901
|
SRI
|
sorcin
|
|
chr8_-_107023
|
0.339
|
NM_001005504
|
OR4F21
|
olfactory receptor, family 4, subfamily F, member 21
|
|
chr2_+_238432925
|
0.338
|
NM_005855
|
RAMP1
|
receptor (G protein-coupled) activity modifying protein 1
|
|
chr7_+_141265085
|
0.338
|
NM_001001656
|
OR9A4
|
olfactory receptor, family 9, subfamily A, member 4
|
|
chr3_-_9266251
|
0.337
|
NM_001033117
NM_014850
|
SRGAP3
|
SLIT-ROBO Rho GTPase activating protein 3
|
|
chr13_-_109600709
|
0.337
|
|
COL4A1
|
collagen, type IV, alpha 1
|
|
chr22_+_49272078
|
0.336
|
NM_017584
|
MIOX
|
myo-inositol oxygenase
|
|
chr1_-_68688219
|
0.327
|
NM_000329
|
RPE65
|
retinal pigment epithelium-specific protein 65kDa
|
|
chrX_+_123307812
|
0.327
|
NM_001114937
NM_002351
|
SH2D1A
|
SH2 domain containing 1A
|
|
chrX_-_135783496
|
0.325
|
|
|
|
|
chr1_+_35020425
|
0.325
|
NM_001005752
|
GJB3
|
gap junction protein, beta 3, 31kDa
|
|
chr20_+_17628592
|
0.319
|
NM_001014977
NM_178477
|
BANF2
|
barrier to autointegration factor 2
|
|
chr11_-_6418705
|
0.316
|
NM_000613
|
HPX
|
hemopexin
|
|
chr1_-_226670928
|
0.314
|
|
TRIM17
|
tripartite motif containing 17
|
|
chr4_-_3503951
|
0.311
|
NM_002337
|
LRPAP1
|
low density lipoprotein receptor-related protein associated protein 1
|
|
chr15_+_76171981
|
0.309
|
NM_001101404
|
SH2D7
|
SH2 domain containing 7
|
|
chr17_+_31195760
|
0.309
|
|
TAF15
|
TAF15 RNA polymerase II, TATA box binding protein (TBP)-associated factor, 68kDa
|
|
chr11_+_56224436
|
0.307
|
NM_001005213
NM_001013358
|
OR9G1
OR9G9
|
olfactory receptor, family 9, subfamily G, member 1
olfactory receptor, family 9, subfamily G, member 9
|
|
chr4_-_84254932
|
0.305
|
NM_001130715
NM_016619
|
PLAC8
|
placenta-specific 8
|
|
chr11_+_48194937
|
0.303
|
NM_001005470
|
OR4B1
|
olfactory receptor, family 4, subfamily B, member 1
|
|
chr4_-_84254873
|
0.302
|
|
PLAC8
|
placenta-specific 8
|
|
chr14_+_28306633
|
0.302
|
|
FOXG1
|
forkhead box G1
|
|
chr9_+_123088690
|
0.294
|
|
GSN
|
gelsolin
|
|
chr7_-_50596238
|
0.290
|
NM_000790
|
DDC
|
dopa decarboxylase (aromatic L-amino acid decarboxylase)
|
|
chr16_-_31054563
|
0.288
|
NM_002773
|
PRSS8
|
protease, serine, 8
|
|
chr7_+_104468614
|
0.287
|
|
MLL5
|
myeloid/lymphoid or mixed-lineage leukemia 5 (trithorax homolog, Drosophila)
|
|
chr7_-_14847479
|
0.285
|
NM_004080
NM_145695
|
DGKB
|
diacylglycerol kinase, beta 90kDa
|
|
chr16_+_22011362
|
0.285
|
NM_173615
|
VWA3A
|
von Willebrand factor A domain containing 3A
|
|
chr2_-_190635566
|
0.284
|
NM_005259
|
MSTN
|
myostatin
|
|
chr5_-_59819642
|
0.284
|
NM_001165899
|
PDE4D
|
phosphodiesterase 4D, cAMP-specific
|
|
chr8_-_11739592
|
0.280
|
|
CTSB
|
cathepsin B
|
|
chr1_+_179269761
|
0.277
|
|
MR1
|
major histocompatibility complex, class I-related
|
|
chr1_+_46745254
|
0.277
|
NM_147192
NM_172225
|
DMBX1
|
diencephalon/mesencephalon homeobox 1
|
|
chr1_-_46853380
|
0.274
|
NM_145279
|
MOBKL2C
|
MOB1, Mps One Binder kinase activator-like 2C (yeast)
|
|
chr19_+_53770804
|
0.272
|
NM_004605
|
SULT2B1
|
sulfotransferase family, cytosolic, 2B, member 1
|
|
chr9_+_130684189
|
0.270
|
NM_001127245
NM_019594
|
LRRC8A
|
leucine rich repeat containing 8 family, member A
|
|
chr7_+_147667461
|
0.268
|
|
CNTNAP2
|
contactin associated protein-like 2
|
|
chr16_-_31068329
|
0.266
|
|
PRSS36
|
protease, serine, 36
|
|
chr1_-_149415049
|
0.264
|
NM_013353
|
TMOD4
|
tropomodulin 4 (muscle)
|
|
chrX_-_44087778
|
0.264
|
NM_025184
|
EFHC2
|
EF-hand domain (C-terminal) containing 2
|
|
chr11_-_4902144
|
0.264
|
NM_001005237
|
OR51G1
|
olfactory receptor, family 51, subfamily G, member 1
|
|
chr1_+_27591738
|
0.263
|
NM_005281
|
GPR3
|
G protein-coupled receptor 3
|
|
chr11_-_5232480
|
0.261
|
NM_000184
|
HBG1
HBG2
|
hemoglobin, gamma A
hemoglobin, gamma G
|
|
chr2_+_48649662
|
0.260
|
NM_172311
|
STON1-GTF2A1L
|
STON1-GTF2A1L readthrough
|
|
chr14_+_94117511
|
0.258
|
|
SERPINA5
|
serpin peptidase inhibitor, clade A (alpha-1 antiproteinase, antitrypsin), member 5
|
|
chr1_+_151081953
|
0.257
|
NM_001128600
|
LCE6A
|
late cornified envelope 6A
|
|
chr11_-_5946299
|
0.251
|
NM_001146033
|
OR56A5
|
olfactory receptor, family 56, subfamily A, member 5
|
|
chr19_+_43502360
|
0.249
|
|
KCNK6
|
potassium channel, subfamily K, member 6
|
|
chr17_-_51155073
|
0.246
|
NM_018286
|
TMEM100
|
transmembrane protein 100
|
|
chr6_+_132915522
|
0.244
|
NM_053278
|
TAAR8
|
trace amine associated receptor 8
|
|
chr21_-_35174742
|
0.243
|
|
RUNX1
|
runt-related transcription factor 1
|
|
chr2_-_119322228
|
0.242
|
NM_001426
|
EN1
|
engrailed homeobox 1
|
|
chrX_+_125781427
|
0.242
|
NM_001122716
|
CXorf64
|
chromosome X open reading frame 64
|
|
chr2_+_172530120
|
0.242
|
|
HAT1
|
histone acetyltransferase 1
|
|
chr9_-_34387786
|
0.239
|
NM_032596
|
C9orf24
|
chromosome 9 open reading frame 24
|
|
chr2_+_189547377
|
0.236
|
|
COL3A1
|
collagen, type III, alpha 1
|
|
chr8_+_104900591
|
0.234
|
NM_014677
|
RIMS2
|
regulating synaptic membrane exocytosis 2
|
|
chr6_-_49820030
|
0.228
|
NM_001190986
NM_006061
|
CRISP3
|
cysteine-rich secretory protein 3
|
|
chr3_+_129117007
|
0.227
|
|
KBTBD12
|
kelch repeat and BTB (POZ) domain containing 12
|
|
chr7_+_91762227
|
0.226
|
|
|
|
|
chr14_-_80934523
|
0.226
|
NM_033104
|
STON2
|
stonin 2
|
|
chr11_-_116199145
|
0.226
|
NM_000482
|
APOA4
|
apolipoprotein A-IV
|
|
chr2_+_189547358
|
0.222
|
|
COL3A1
|
collagen, type III, alpha 1
|
|
chr12_-_66905802
|
0.218
|
NM_018402
|
IL26
|
interleukin 26
|
|
chr19_-_58086410
|
0.218
|
NM_207333
|
ZNF320
|
zinc finger protein 320
|
|
chr11_-_67163600
|
0.217
|
NM_005995
|
TBX10
|
T-box 10
|